Bridging the behavior-neural gap: A multimodal AI reveals the brain's geometry of emotion more accurately than human self-reports

Changde Du1,3,†, Yizhuo Lu1,2,†, Zhongyu Huang1,3,†, Yi Sun1,3, Zisen Zhou4, Shaozheng Qin4, Huiguang He1,2,3,*
1State Key Laboratory of Brain Cognition and Brain-inspired Intelligence Technology, Institute of Automation, Chinese Academy of Sciences, Beijing, 100190, China.
2School of Future Technology, University of Chinese Academy of Sciences, Beijing, 100049, China.
3School of Artificial Intelligence, University of Chinese Academy of Sciences, Beijing, 100049, China
4State Key Laboratory of Cognitive Neuroscience and Learning, Beijing Normal University, Beijing, China
These authors contributed equally
*corresponding author: Huiguang He (huiguang.he@ia.ac.cn)

Abstract

The ability to represent emotion plays a significant role in human cognition and social interaction, yet the high-dimensional geometry of this affective space and its neural underpinnings remain debated. A key challenge, the ‘behavior-neural gap,’ is the limited ability of human self-reports to predict brain activity. Here we test the hypothesis that this gap arises from the constraints of traditional rating scales and that large-scale similarity judgments can more faithfully capture the brain's affective geometry. Using AI models as ‘cognitive agents,’ we collected millions of triplet odd-one-out judgments from a multimodal large language model (MLLM) and a language-only model (LLM) in response to 2,180 emotionally evocative videos. We found that the emergent 30-dimensional embeddings from these models are highly interpretable and organize emotion primarily along categorical lines, yet in a blended fashion that incorporates dimensional properties. Most remarkably, the MLLM's representation predicted neural activity in human emotion-processing networks with the highest accuracy, outperforming not only the LLM but also, counterintuitively, representations derived directly from human behavioral ratings. This result supports our primary hypothesis and suggests that sensory grounding—learning from rich visual data—is critical for developing a truly neurally-aligned conceptual framework for emotion. Our findings provide compelling evidence that MLLMs can autonomously develop rich, neurally-aligned affective representations, offering a powerful paradigm to bridge the gap between subjective experience and its neural substrates.

Visualization of MLLM's 30-dimensional affective embeddings, with the top 9 video stimuli exhibiting the highest activation in each dimension.

Visualization of LLM's 30-dimensional affective embeddings.

Visualization of Human (category)'s 30-dimensional affective embeddings.

Visualization of Human (dimension)'s 30-dimensional affective embeddings.

Overview of our work.

Overview of the experimental and analytical pipeline.

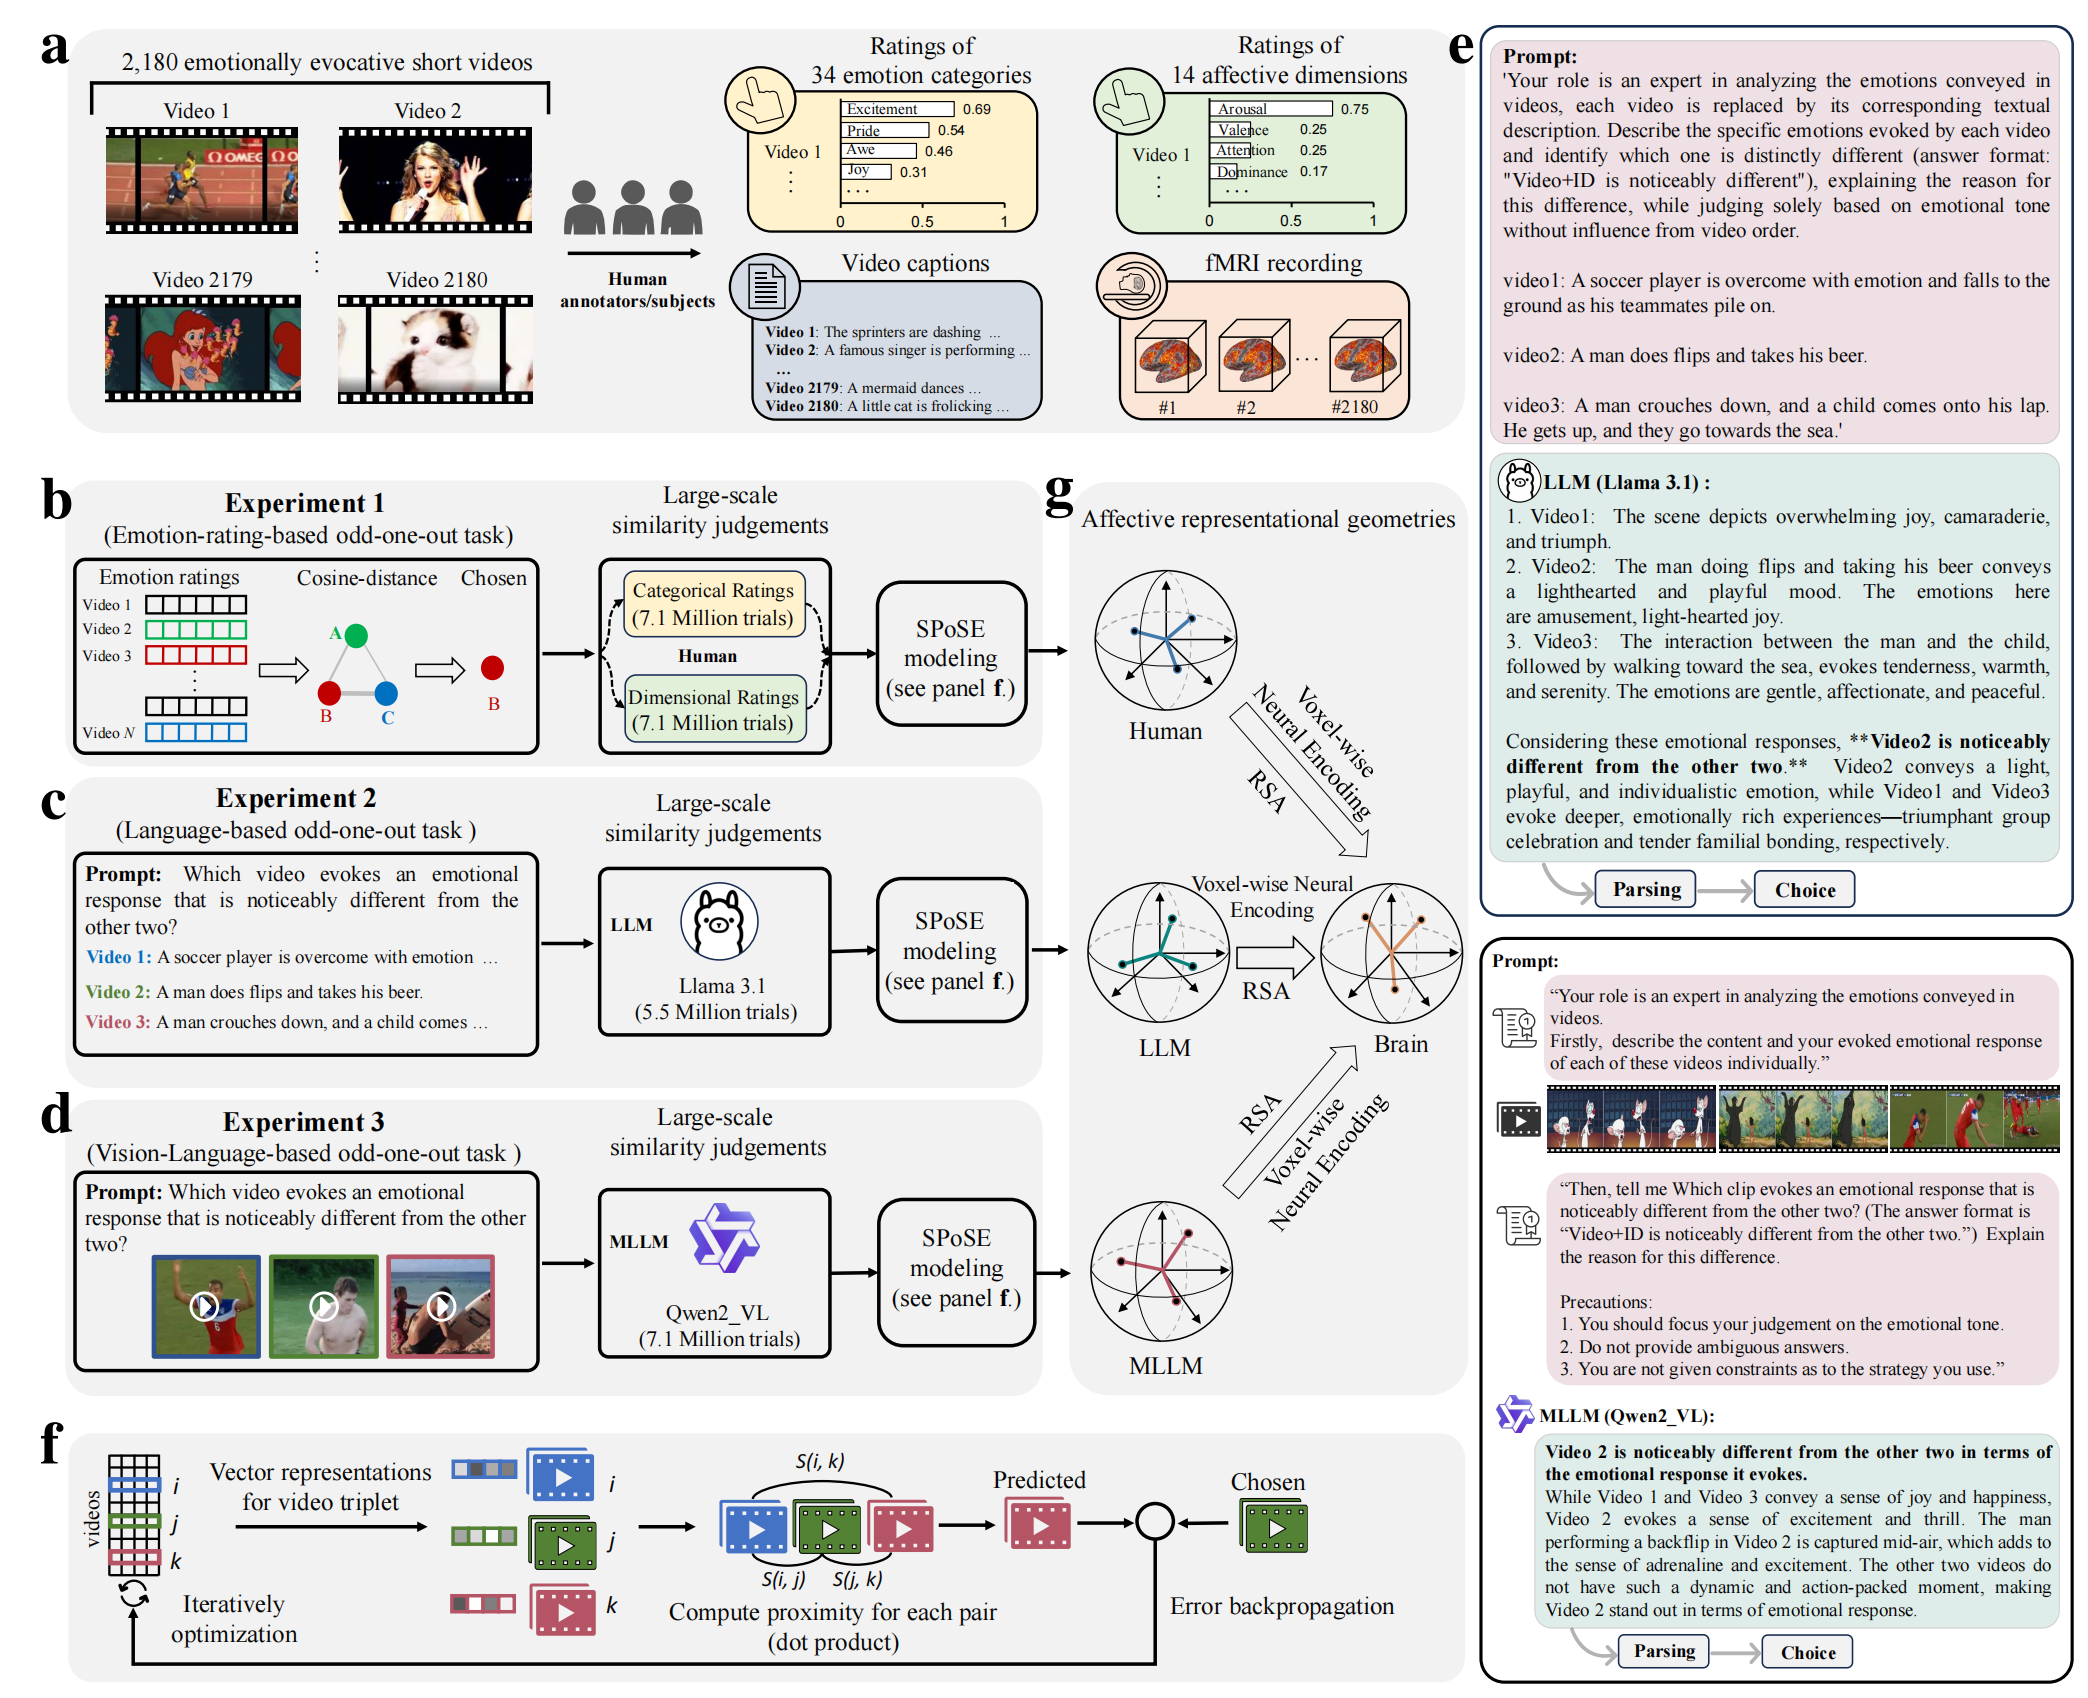
a, The study utilized a database of 2,180 emotionally evocative videos with rich, pre-existing annotations, including human ratings on discrete emotion categories and continuous affective dimensions, detailed textual descriptions, and corresponding fMRI data from viewers. b-d, Affective embeddings were derived for four systems—human categorical ratings, human dimensional ratings, LLM, and MLLM—using a triplet odd-one-out behavioral paradigm. Human similarity judgments were simulated based on the cosine similarity of their prior ratings, while models performed the task directly. e, Example prompts and responses for the LLM and MLLM. f-g, Latent embeddings were learned from over 7.1 million triplet judgments using SPoSE (f), and the resulting representational spaces were compared to each other and to neural data (g).

Bridging the behavior-neural gap with affective representations derived from MLLM.

MLLM representations show superior alignment with neural representations of emotion.

a-b, Results of searchlight RSA between model and brain, averaged in subcortical (a) and cortical (b) ROIs (averaged across subjects (N=5)). Dots represent individual subjects; error bars reflect standard deviation (s.d.); all statistics are two-tailed t-tests across subjects, with false discovery rate (FDR) correction; stars indicate significant differences between MLLM and the compared model (P < 0.05). c, Whole-cortex maps of searchlight RSA for a representative subject, illustrating the MLLM's superior performance across distributed emotion-processing networks. All coloured voxels are predicted significantly (P < 0.05, FDR-corrected, two-tailed t-tests). d, Voxel-wise comparison of the MLLM's performance against the human categorical, dimensional and concatenated ratings model, using searchlight RSA.

Models develop interpretable, categorical, and blended affective representations.

Models develop interpretable, categorical, and blended affective components.

a, t-SNE visualization of the 2,180 stimuli reveals the global structure of the affective spaces. Points are colored by their highest-rated human emotion category, showing spontaneous clustering. b, Top-3 nearest-centroid accuracy, quantifying the categorical structure. c-e, Examples of shared (c), unique (d), and blended (e) affective components, with top-weighted video frames and word clouds (the size of the label is proportional to its correlation coefficient with human ratings). f, Proportion of components that were interpretable versus uninterpretable. g, Proportion of interpretable components best described as purely categorical, purely dimensional, or a mix of both.

Models computationally reconcile the category-dimension debate with a hybrid coding scheme.

Learned affective spaces are primarily organized by emotion categories.

Correlation heatmaps showing the relationship between the 30 learned affective components (y-axes) and the 48 categories/dimensions from human self-reports (x-axes; 34 categories and 14 dimensions from Cowen et al.). Each cell represents the PCC between a learned component and a human-rated category or dimension. The strong diagonal patterns observed for the LLM (c) and MLLM (d)—mirroring the pattern from human categorical data (a) but not dimensional data (b)—indicate that the models' affective spaces are predominantly structured along categorical, rather than dimensional, lines.

Illustration of example video stimuli with their dominant dimensions.

Interpretation of the dimensions in the learned affective embeddings.

Illustration of example video stimuli with their dominant dimensions. Each petal's length corresponds to the expression magnitude of a particular dimension, with unlabeled dimensions reflecting negligible weight contributions for visualization clarity.

Visualizing Attribution in (M)LLM Emotion Recognition: GradCAM Heatmap Analysis.

Dimensional interpretation of learned affective embeddings using GradCAM.

Heatmap visualization of affective elicitation in video stimuli. The color gradient indicates regional contributions to affective elicitation, with red areas representing stronger effects and blue areas weaker effects.

Verifying Causal Interpretability of Affective Embeddings through Dimensional Manipulation.

Modifying the affective content of videos through dimensional manipulation of affective embeddings.

a, Our manipulation of specific emotional experiences was achieved by reducing the activation values along targeted dimensions in the affective embeddings (SPoSE embeddings). The first row displays frames from the original video. In the second row, red bounding boxes highlight the target dimension to be manipulated, with its corresponding label and original activation value (normalized to [0,1]) annotated above. The third row presents the activation heatmap for this dimension. The fourth row shows video frames after decreasing the original activation value to 0.2, demonstrating that precisely the regions highlighted in the heatmap were modified. b, The corresponding emotional experience can be elicited in videos by augmenting specific dimension values in the affective embeddings. The subfigure displays the edited video frames obtained by increasing the value of a specific dimension in the affective embedding to 0.8. Note: Due to space constraints, only the dimension label with the highest PCC is shown in the figure. For complete labels, please refer to the main text.

Convergent evolution and divergent signatures in human and artificial affect.

Convergent and divergent structures of affective spaces across humans and models.

a-d, Affective graphs (left) and community structure (right) for each of the four embedding spaces. In the graphs, nodes are affective components, and edge width is proportional to the Pearson correlation between them (r > 0.2). In the community plots, components are grouped into clusters using the Louvain algorithm, with node size reflecting PageRank centrality. Isolated nodes are excluded. e, The overlap of affective clusters across all four systems, highlighting both shared and unique high-level structures. f, Dimensionality reduction analysis showing the minimum number of principal components required to retain 95%–99% of the predictive accuracy on the behavioral task (gray shaded area). The chance-level accuracy is marked by the red dashed line.